Usage
How to Navigate the Dashboard
Navigate to KD3ALD’s Dashboard, once loaded wait at least 30 seconds for data to appear.
Note: This website is running at my home QTH in gridsquare FN21ni, on a semi-slow internet connection, load times may be longer than 30 seconds if under heavy use.
Once the Dashboard is loaded, something similar to the image below should be displayed
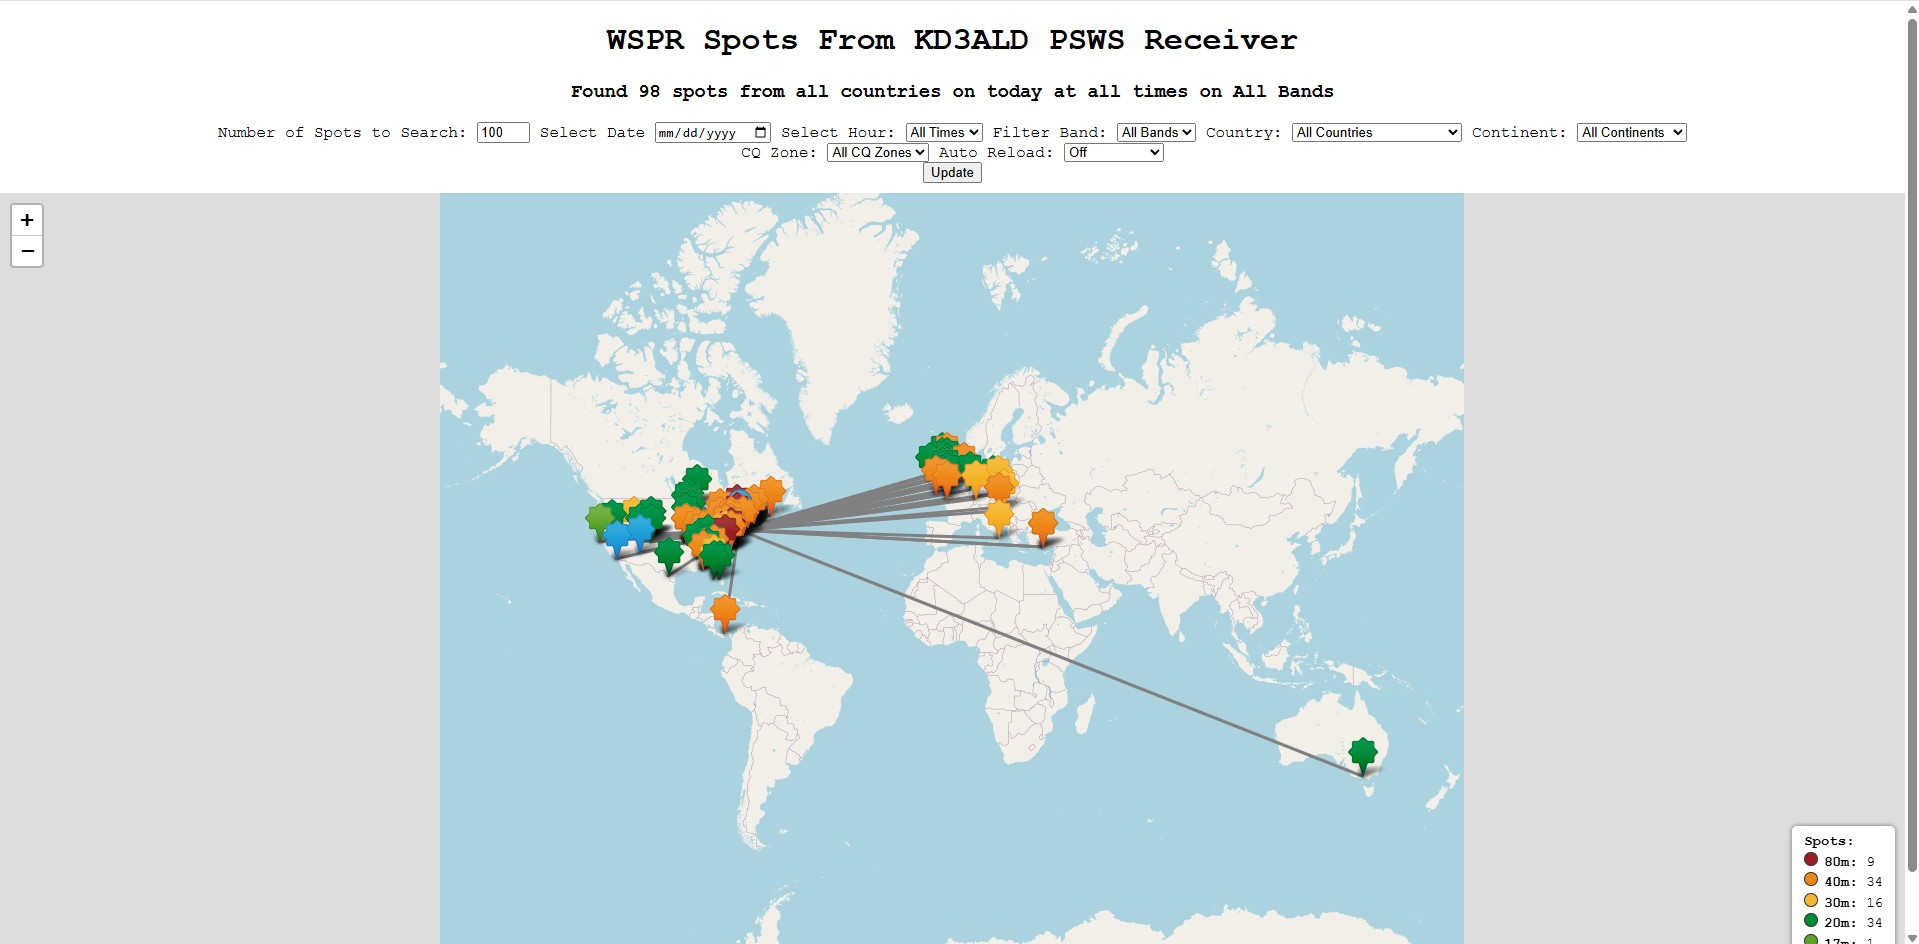
On the dashboard you will see many filters, they are all listed below (Left to Right):
Number of Spots Displayed
I would recommend around 250-400 Spots at a time if using Chrome
Date of Data Being Displayed
Time of Data Being Displayed
Note: Leaving both Date and Time blank displays latest data
Band Being Displayed
Country Being Displayed
Continent Being Displayed
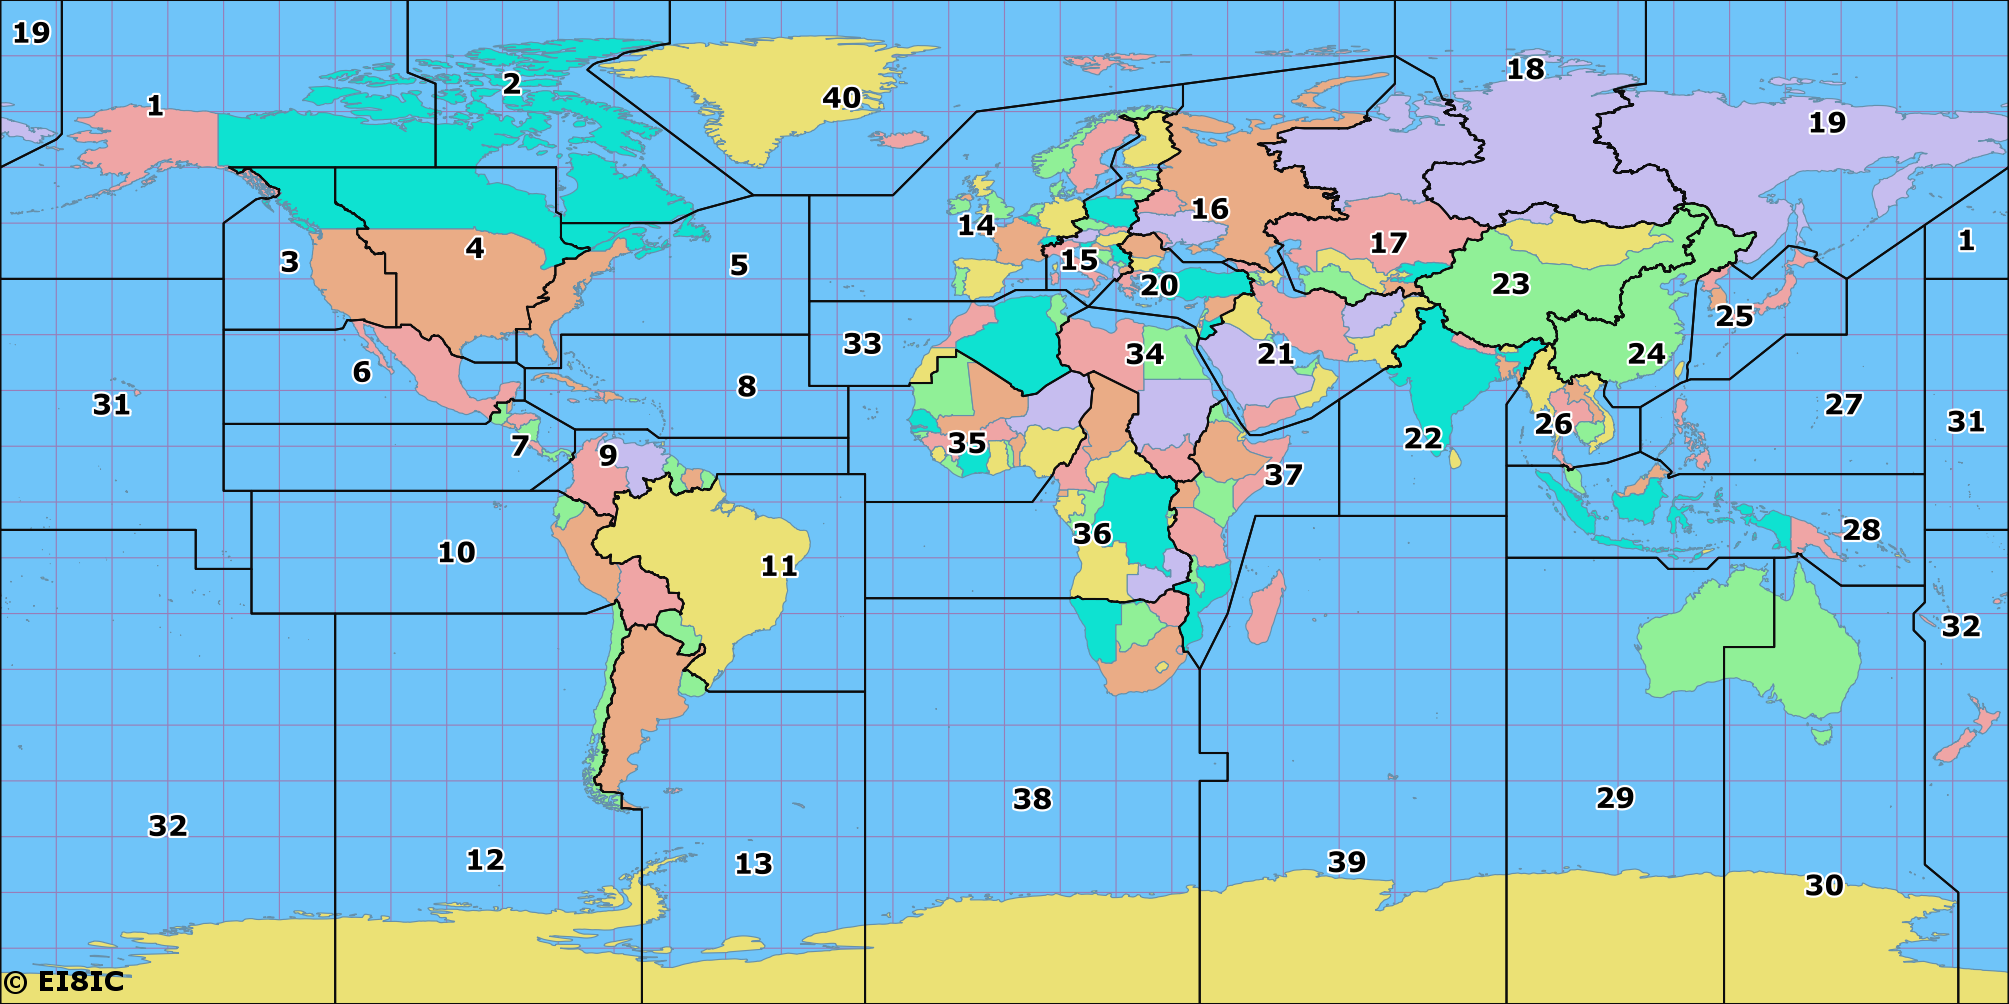
CQ Zone Being Displayed
Map Auto Reload Interval
Whenever a change is made to filters you must click update to show filtered spots
Each Spot displayed is mapped based off of grid square. All spots and paths are clickable on the map. They display information for the spot that is being viewed. Information includes: Transmitting Callsign, SNR, Exact Frequency, Date and time, Band, and Number of spots decoded from that spot.
Spots are color coded by band. On the bottom right of the map, is the band counts. Below is all colors and band mappings.
Band |
Color Name |
Preview |
|---|---|---|
160m |
black |
#211D1E |
80m |
red |
#991F24 |
60m |
orange-dark |
#D43019 |
40m |
orange |
#EE8918 |
30m |
yellow |
#F5B72D |
20m |
green |
#008B38 |
17m |
green-light |
#5AA429 |
15m |
cyan |
#21A2DA |
12m |
blue-dark |
#183C52 |
10m |
blue-dark |
#183C52 |
6m |
purple |
#4E2960 |
4m |
violet |
#8B1E89 |
2m |
pink |
#BB4A99 |
70cm |
white |
#F5F4F5 |
unknown |
green-dark |
#004B22 |
Please contact Owen Ruzanski at owen.ruzanski@scranton.edu with any issues or suggestions!